- Introduction
- The Oscilloscope Display
- Oscilloscope Display Components: A Closer Look
- Waveform
- Grid
- Scale
- Trigger
- Markers
- Status Information
- Signals on an Oscilloscope Display
- Periodic Waves
- Random Signals
- Transient Signals
- Deciphering the Oscilloscope Display: A Step-by-Step Guide
- Step 1: Connect the Probe to the Device and the Oscilloscope
- Step 2: Adjust the Voltage and Time Scale
- Step 3: Set the Trigger to Stabilize the Waveform
- Step 4: Use the Grid to Measure the Waveform's Characteristics
- Step 5: Apply the Scale to Convert the Grid Measurements to Real Values
- Step 6: Use Markers for Precise Manual Measurements
- Oscilloscope Display Features
- Interpreting Waveform Measurements
- Conclusion
- Whenever You’re Ready, Here Are 5 Ways We Can Help You
Did you know that without a tool known as an oscilloscope, much of the innovation we see in electronics may have never been realized? The oscilloscope display, comparable to a sort of microscope, allows us to observe and decode the intricate dance of electrical signals within our devices. This seemingly modest screen, filled with complex waveforms, letsus to investigate, troubleshoot, and design electronics by unveiling the invisible language of circuits.
From understanding the basic components of the display to the art of reading waveforms, we'll unlock the doors to an understanding that bridges the gap between us and the abstract language of electronics.
Buy Oscilloscopes at a Great Discount


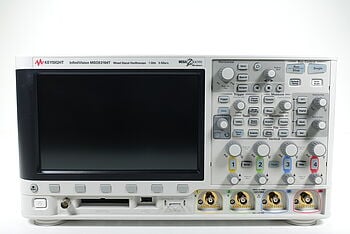
The Oscilloscope Display
Housed within the oscilloscope, the display is a visual interface that represents voltage signals graphically as a function of time. This key component transforms abstract electrical fluctuations into tangible, visual information, giving you direct insight into the behavior of electronic circuits.
The oscilloscope screen is a vital tool that brings the behavior of electrons in an electrical circuit into sharp focus. With voltage measured on the vertical axis (Y-axis) and time on the horizontal axis (X-axis), it creates a visual pattern known as a waveform. This depiction allows us to observe the signal's oscillations, providing valuable insights into characteristics such as amplitude, frequency, and time period.
| Key Takeaway |
|---|
| The oscilloscope display serves as a visual interpreter, transforming complex electronic signals into understandable waveforms. Engineers can gain valuable insights into the performance, issues, and potential improvements of their circuits and systems by understanding the components of their oscilloscope and mastering its language. |
Oscilloscope Display Components: A Closer Look
Understanding the display means delving deeper into the various components that bring the screen to life. Each of these elements, working in unison, helps create a comprehensive and meaningful representation of electronic signals. Let's explore each one in more detail:
Waveform
The waveform is the visual heartbeat of the oscilloscope, an expression of your electrical signal as it fluctuates over time. Its movement on the display tells a story of the signal's behavior – the peaks and valleys indicate the voltage changes, the rhythm denotes the frequency and period, and much more. With a skilled eye, you can glean a wealth of information about the circuit's performance just by observing these patterns.
Grid
The oscilloscope's grid acts as a canvas for the waveform. This grid is divided into smaller sections known as divisions, both horizontally and vertically, offering a spatial reference for the waveform. By comparing the waveform to these divisions, you can estimate important parameters such as amplitude, frequency, and time duration of the signal.
Scale
The scale is your key to interpreting the grid divisions. Each division represents a specific quantity of voltage (vertical scale) or time (horizontal scale), which can be adjusted according to the signal being measured. By understanding the scale, you can translate the waveform's position and size on the grid into real-world values.
Trigger
The trigger is akin to a gatekeeper, deciding when the oscilloscope captures and displays a signal. By setting a specific trigger condition – such as a certain voltage level – you ensure that the waveform displayed is stable and meaningful. This allows you to focus on specific events or characteristics within your signal.
Markers
Markers are like the fine-tipped pens of the oscilloscope world, used for making precise, manual measurements on the display. These can be moved around to mark specific points or sections of the waveform, enabling detailed examination and accurate reading of various signal characteristics.
Status Information
The status information on the display keeps you informed about the oscilloscope's current settings. This includes the time and voltage scale settings, the active input channel, the trigger conditions, and more. This information is essential to understand the context of your measurements, ensuring that you interpret the displayed waveform correctly.
Signals on an Oscilloscope Display
The oscilloscope display is a stage where various types of signals make their appearance. Understanding these actors is crucial for interpreting the story they tell about the performance and behavior of your circuits. Here's an expanded look at the three primary signal types you'll encounter on the display:
Periodic Waves
Periodic waves are the regular beat of the oscilloscope world. Like a metronome, they maintain a consistent rhythm, repeating their pattern at regular intervals. These signals are most often the intentional output of oscillating circuits, such as clock signals in a microcontroller or the sinusoidal output from an AC generator. The usual suspects include:
- Sine Waves: These signals feature smooth, periodic oscillations that are identical in each cycle. They're often seen in natural and man-made oscillations, like audio signals or power lines.
- Square Waves: Characterized by their abrupt transitions between high and low values, square waves are common in digital circuits. Their shape makes them ideal for clock signals and timing purposes.
- Sawtooth Waves: Sawtooth waves are signals that look like the teeth of a saw. They gradually increase or decrease, and then reset sharply. They are commonly used for controlling the brightness of LEDs or generating sounds in synthesizers.
Random Signals
In contrast to the predictable periodic waves, random signals are the wild cards of the oscilloscope world. They exhibit no discernible pattern, and their values are unpredictable, often resulting from complex system responses or unwanted noise.
Possible sources of interference can be electrical noise from components within a circuit, signals from nearby devices, or signals from complex systems such as biological signals (EEG, EKG) or environmental sensors. Understanding and identifying these signals is crucial for troubleshooting and signal integrity analysis.
Transient Signals
Transient signals are like shooting stars in the oscilloscope universe: sudden, temporary, and non-repeating. These often occur as a result of a specific event or change in the system, such as a switch being turned on or off, a circuit being plugged in or disconnected, or a capacitor charging and discharging.
These signals provide valuable insights into a circuit’s behavior at the moment of these changes, and they're vital for understanding the system’s stability, response time, and potential for transient-based errors or damages.
Deciphering the Oscilloscope Display: A Step-by-Step Guide
Learning to read an oscilloscope display is indeed like mastering a new language. With practice and familiarity, what may initially seem like a complicated mess of waveforms and markers can quickly become second nature, revealing the intricate details of your electronic signals.
Let's dive into this step-by-step guide that will equip you with the essential skills to interpret the oscilloscope display.
Step 1: Connect the Probe to the Device and the Oscilloscope
Reading an oscilloscope display begins by establishing a connection between the oscilloscope and the electronic device under test (DUT) using the probe. The probe acts as a bridge, transferring the electronic signals from the DUT to the oscilloscope. Make sure you correctly connect the probe to the appropriate points in your circuit to capture the desired signals.
Step 2: Adjust the Voltage and Time Scale
Your next step involves adjusting the oscilloscope's voltage and time scales to capture the full breadth of the waveform. This step is akin to adjusting the lens on a microscope or telescope to ensure you have the full picture in view. You want to ensure the waveform fits comfortably within the display, neither too compressed nor overflowing.
Step 3: Set the Trigger to Stabilize the Waveform
Setting the trigger is like snapping the perfect photograph of a fast-moving object. The trigger freezes the waveform on the display, allowing you to observe it clearly. By defining a specific voltage level or event as the trigger point, the oscilloscope captures and displays a stable waveform, making it easier for you to measure and analyze.
Step 4: Use the Grid to Measure the Waveform's Characteristics
The grid on the oscilloscope display is your ruler, offering a reference point to measure the waveform's characteristics. Use it to observe the waveform's amplitude (how tall it is), frequency (how fast it oscillates), and any unique characteristics (like sudden spikes or dips).
Step 5: Apply the Scale to Convert the Grid Measurements to Real Values
After making estimations using the grid, you'll need to convert these measurements to real-world values. This conversion is accomplished by applying the voltage and time scales set earlier. For example, if the vertical scale is set to 2 volts per division and the waveform peaks at 3 divisions, the peak voltage is 6 volts.
Step 6: Use Markers for Precise Manual Measurements
For more detailed analysis, use the markers on your oscilloscope display. These can be dragged to specific points on the waveform to measure precise values or changes. This technique can be particularly helpful when looking at intricate details, such as the rise and fall times of a signal, or when comparing different parts of a waveform.
Oscilloscope Display Features
Modern oscilloscope displays offer several advanced features for even more precise analysis:
- Waveform Math: Allows you to add, subtract, or multiply waveforms.
- FFT (Fast Fourier Transform): Transforms your time-domain signal into its frequency components.
- Persistence Mode: Helps visualize variations in signal behavior over time.
- Automatic Measurements: Automatically calculates parameters like frequency, rise time, etc.
Interpreting Waveform Measurements
| Measurement | Description |
|---|---|
| Amplitude | The maximum value of the waveform above or below the centerline. |
| Peak-to-Peak | The time difference between the maximum and minimum values of the waveform. |
| Period | The duration of one full cycle of the waveform. |
| Frequency | The number of cycles the waveform completes in one second. |
| Rise Time | The time the waveform takes to rise from a low to a high value. |
| Fall Time | The time the waveform takes to fall from a high to a low value. |
| Duty Cycle | The percentage of one period in which the waveform is above the centerline. |
Conclusion
The oscilloscope is an essential tool for any electrical engineer. By breaking down its components – waveforms, grid, scale, trigger, markers, and status information – we've learned how to decode this complex language.
We've also recognized the diverse types of signals – periodic, random, and transient – that paint our display, and learned a systematic approach to read and understand these waveforms.
Ahigh-quality oscilloscope can offer more accurate readings, advanced functions, and overall better performance. Keysight's Used Equipment Store offers a wide range of fully tested, high-quality used oscilloscopes, signal analyzers and network analyzers that can meet your needs without stretching your budget. This gives you the opportunity to acquire the precision tools you need while maximizing your investment. Visit Keysight's Used Equipment Store today to explore our selection of premium test equipment.
Browse Oscilloscopes at a Great Discount
Whenever You’re Ready, Here Are 5 Ways We Can Help You
- Browse our Premium Used Oscilloscopes.
- Call tech support US: +1 800 829-4444
Press #, then 2. Hours: 7 am – 5 pm MT, Mon– Fri - Talk to our sales support team by clicking the icon (bottom right corner) on every offer page
- Create an account to get price alerts and access to exclusive waitlists.
- Talk to your account manager about your specific needs.