- Introduction
- What is Amplitude?
- Time Domain vs. Frequency Domain
- Selecting the Right Oscilloscope for Amplitude-over-Time Analysis
- Analog Oscilloscopes
- Digital Storage Oscilloscopes (DSOs)
- Digital Phosphor Oscilloscopes (DPOs)
- Mixed Signal Oscilloscopes (MSOs)
- Choosing the Right Oscilloscope for Amplitude-over-Time Analysis
- The Crucial Role of Amplitude-over-Time Measurements in Electrical Engineering
- Debugging Circuits: Pinpointing Signal Issues
- Ensuring Signal Integrity: The Litmus Test for Quality
- Performance Analysis: Measuring Key Parameters
- Comprehensive System Optimization
- Mastering Measurement Techniques for Optimal Amplitude-over-Time Analysis
- Vertical Resolution
- Sample Rate
- Trigger Settings
- Interpretation of Results
- Conclusion
- Whenever You’re Ready, Here Are 5 Ways We Can Help You
Engineers, have you ever considered how the simple graph of amplitude versus time on your oscilloscope’s display translates into complex system behaviors and characteristics?
For electrical engineers and professionals in related fields, the ability to interpret amplitude-over-time plots isn't just an academic exercise; it's integral to debugging circuits, validating designs, and optimizing system performance.
This article dives deep into the technical aspects and applications of amplitude-over-time measurements in oscilloscopes, providing you with actionable insights for your next engineering challenge.
What is Amplitude?
- Voltage amplitude: The maximum voltage level of a signal.
- Current amplitude: The maximum current level of a signal.
Amplitude, in simple terms, measures the maximum distance of a waveform from its equilibrium position.
When an oscilloscope plots amplitude against time, it provides a graph that visualizes how the amplitude of an electrical signal changes over a defined period.
Time Domain vs. Frequency Domain
- Time domain: Shows how a signal changes over time.
- Frequency domain: Shows how the signal's energy distributes across various frequencies.
While spectrum analyzers commonly handle the frequency domain, oscilloscopes specialize in time-domain analyses.
| Key Takeaway |
|---|
| The amplitude-over-time graph on an oscilloscope is a multifaceted tool that provides critical insights into circuit behavior, signal integrity, and system performance. Mastering its complexities through appropriate measurement techniques and equipment selection can significantly elevate the quality of your engineering analyses. |
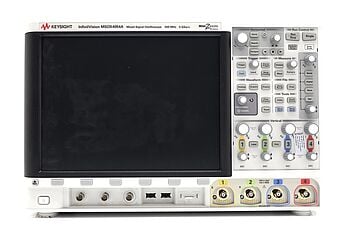
Certified Refurbished Oscilloscopes On Sale Now


Selecting the Right Oscilloscope for Amplitude-over-Time Analysis
Oscilloscopes have evolved significantly over the years, leading to a variety of types designed to meet specific measurement needs.
Different types of oscilloscopes have their own advantages for analyzing amplitude over time.
Here, we categorize and elaborate on these oscilloscopes to help you choose the most suitable device for your projects.
Analog Oscilloscopes
- Real-time observations: Analog oscilloscopes excel at displaying signals in real-time, providing immediate visual feedback.
- Direct signal processing: Since they operate in a purely analog domain, there's no latency induced by analog-to-digital conversion.
- Limitations: Limited in storage and advanced measurement capabilities.
Digital Storage Oscilloscopes (DSOs)
- Waveform capture and storage: DSOs allow for the storage of waveforms for later analysis, essential for intermittent or complex signals.
- Advanced measurements: Features like Fast Fourier Transform (FFT) and automated parameter calculation make DSOs versatile.
- Resolution: Generally limited to 8-bit resolution, although specialized DSOs with higher resolutions are available.
Digital Phosphor Oscilloscopes (DPOs)
- Intensity grading: By mimicking the behavior of traditional analog phosphor screens digitally, DPOs offer intensity grading to differentiate between frequently and rarely occurring events.
- Advanced analysis: Like DSOs, they also offer various measurement and mathematical capabilities.
- Real-time insight: DPOs are particularly good at displaying signals that change dynamically over time.
Mixed Signal Oscilloscopes (MSOs)
- Multiple inputs: MSOs combine the capabilities of DSOs with a logic analyzer, offering both analog and digital channel inputs.
- Complex systems: Ideal for systems that involve both analog and digital components, such as embedded systems.
- Integrated analysis: Provides a unified view of multiple signals, simplifying debugging and analysis.
By understanding the pros and cons of each oscilloscope type, you can make an informed decision on the best fit for your amplitude-over-time measurement needs.
Choosing the Right Oscilloscope for Amplitude-over-Time Analysis
| Engineering Challenge | Best Suited Oscilloscope Type | Reasons & Features to Consider |
|---|---|---|
| Immediate signal feedback | Analog Oscilloscopes | Real-time analysis, direct signal processing. |
| Detailed waveform analysis | Digital Storage Oscilloscopes | Waveform capture, advanced measurements. |
| Dynamic signal behavior | Digital Phosphor Oscilloscopes | Real-time insights, intensity grading. |
| Mixed-signal analysis | Mixed Signal Oscilloscopes | Analog and digital channel inputs, integrated analysis. |
The Crucial Role of Amplitude-over-Time Measurements in Electrical Engineering
In the electrical engineering realm, the amplitude-over-time graph on an oscilloscope is far from a mere academic abstraction; it's a fundamental tool for practical problem-solving and system optimization.
Let's delve into how this vital measurement impacts various aspects of electrical engineering, from circuit debugging to performance analysis.
Debugging Circuits: Pinpointing Signal Issues
- Identify issues in signal timing: Anomalies like jitter and skew can throw off the timing of a system. By examining the amplitude-over-time plot, engineers can identify these issues, trace their origins, and implement corrective measures.
- Detect glitches or unintended fluctuations in signal amplitude: Spikes or drops in amplitude could indicate problems such as power supply fluctuations, impedance mismatches, or faulty components. Engineers can isolate and correct these issues by accurately reading the amplitude-over-time graph.
Ensuring Signal Integrity: The Litmus Test for Quality
- Evaluate the quality of digital signals: In digital systems, minor changes in amplitude can lead to bit errors, affecting data integrity. Amplitude-over-time measurements help to quantify these changes and validate the quality of digital signals.
- Examine analog signal distortions: For analog signals, distortions like harmonics and noise become visible through amplitude-over-time analysis. Engineers can use these insights to filter out noise or take corrective measures to improve signal quality.
Performance Analysis: Measuring Key Parameters
- Analyze transient response: How quickly a system responds to changes often determines its efficiency and performance. Amplitude-over-time plots can reveal transient behaviors, helping engineers tune systems for optimal responsiveness.
- Measure parameters like rise time, fall time, and pulse width: Knowing these parameters is crucial for tasks ranging from adjusting the speed of digital logic circuits to optimizing the energy efficiency of power electronic devices.
Comprehensive System Optimization
- Feedback loop analysis: Engineers often need to scrutinize how systems respond to various inputs, especially in control systems. Amplitude-over-time plots serve as an invaluable resource for tuning feedback loops.
- Power consumption: By monitoring amplitude variations over time, engineers can get insights into fluctuating power levels, enabling them to design more energy-efficient systems.
Amplitude-over-time measurements aren't just foundational—they are instrumental in refining and perfecting electrical systems.
From debugging circuits to tuning performance, this simple yet powerful analysis empowers engineers to create robust, efficient, and effective solutions.
Mastering Measurement Techniques for Optimal Amplitude-over-Time Analysis
When extracting accurate and valuable data from amplitude-over-time plots, it's all in the details.
Precision in these measurements often hinges on an array of parameters, such as vertical resolution, sample rate, and trigger settings.
Below, we dive into these crucial factors that can make or break the quality of your amplitude-over-time analysis.
Vertical Resolution
- Analog-to-digital converter (ADC) bits: The number of bits in the ADC directly correlates with the amplitude resolution.
- 8-bit ADC: Found in general-purpose oscilloscopes, offering 256 discrete vertical levels.
- 12-bit or Higher ADC: Crucial for high-precision applications, providing finer resolution and more accurate amplitude measurements.
The vertical resolution directly impacts how well you can distinguish between closely spaced amplitude values, which can be particularly important in applications like signal integrity analysis or high-precision measurements.
Sample Rate
- Nyquist Theorem: To reconstruct a signal accurately, you must sample at least twice as fast as the highest frequency component in that signal.
Higher sample rates are not always better, as they can result in more data than necessary, but too low a sample rate can miss vital details. Striking the right balance is key for accurate amplitude-over-time plotting.
Trigger Settings
- Trigger level and slope: Defining the correct trigger settings ensures that your oscilloscope starts measuring at the right point in time.
- Pre- and post-trigger sampling: Allows you to examine what happens before and after the trigger event, which can be crucial in debugging scenarios.
Incorrect trigger settings can lead to inconsistent or misleading results. Properly setting up the trigger ensures that your amplitude-over-time plot represents the true behavior of the system you're studying.
By fine-tuning these parameters, you'll be well-equipped to capture the most accurate and insightful amplitude-over-time measurements, enabling robust analyses and informed decision-making.
Ready to Find The Perfect Oscilloscope?
Interpretation of Results
Interpreting the amplitude-over-time plot is as much an art as it is a science. Beyond simply observing the waveforms, the plot can serve as a treasure trove of information if you know what to look for.
Here are 3 key areas where careful interpretation can make a significant impact:
- Fault identification: Reading the amplitude-over-time plot allows you to pinpoint system faults with precision. Whether it's a voltage spike that shouldn't be there or an unexplained oscillation, these plots often reveal the first signs of a problem, enabling quick diagnostic actions.
- System tuning: By closely examining the amplitude-over-time data, you can make informed decisions on how to optimize your system for peak performance. This might involve adjusting signal parameters, fine-tuning circuit components, or implementing feedback loops to stabilize fluctuating signals.
- Comparative analysis: Another invaluable use of amplitude-over-time plots is in comparative analysis. By overlaying or juxtaposing the amplitude-over-time graphs of different components or systems, you can gain insights into their relative performance or compatibility. This can be particularly useful in troubleshooting complex systems where multiple components interact.
Conclusion
The amplitude-over-time graph on an oscilloscope serves as a powerful diagnostic tool that goes far beyond simple data visualization.
By mastering various measurement techniques and understanding the capabilities of different types of oscilloscopes, you can unlock deeper insights into engineering challenges ranging from debugging circuits to ensuring signal integrity and optimizing performance.
Ready to take your amplitude-over-time analyses to the next level?
Keysight Used Equipment Store offers premium used oscilloscopes, spectrum analyzers, waveform generators, multimeters. and more, that deliver both reliability and performance.
Elevate your engineering projects with top-of-the-line equipment without breaking the bank.
Whenever You’re Ready, Here Are 5 Ways We Can Help You
- Browse our Premium Used Oscilloscopes.
- Call tech support US: +1 800 829-4444
Press #, then 2. Hours: 7 am – 5 pm MT, Mon– Fri - Talk to our sales support team by clicking the icon (bottom right corner) on every offer page
- Create an account to get price alerts and access to exclusive waitlists.
- Talk to your account manager about your specific needs.