- Introduction
- Introduction to Interpolation
- Why Is Interpolation Needed?
- Accuracy in Visualization
- Bandwidth Limitations
- Improved Measurements
- Primary Interpolation Methods
- 1. Sin(x)/x (Sinc) Interpolation
- 2. Linear Interpolation
- 3. Cubic Spline Interpolation
- Comparing Interpolation Methods
- Which Method to Use?
- Challenges and Limitations
- Alias Effects
- Overestimation and Overshoot
- Not a Substitute for Sampling
- Potential for Misinterpretation
- Conclusion
- Whenever You’re Ready, Here Are 5 Ways We Can Help You
Did you know that interpolation methods can turn your seemingly chaotic waveform data into an interpretable and detailed visual representation? Interpolation bridges the gap between sampled points, providing engineers with informative and continuous waveform displays. Let’s delve deep into the fascinating mechanics behind this indispensable tool.
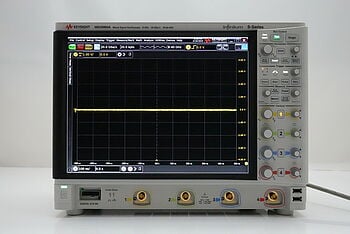
Buy Oscilloscopes at a Great Discount


Introduction to Interpolation
Interpolation is the process of estimating values between two known values. Imagine trying to recreate the entire Mona Lisa by only having access to a few scattered brush strokes – interpolation in oscilloscopes operates on a similar principle. In oscilloscopes, interpolation allows for the construction of a continuous waveform from a series of discrete samples.
| Key Takeaway |
|---|
| Interpolation methods in oscilloscopes bridge the gaps between sampled data points, enhancing waveform visualization and analysis. While these techniques offer improved representations, understanding their mathematical foundations, applications, and inherent limitations is crucial for accurate signal interpretation. |
Why Is Interpolation Needed?
Interpolation serves as the backbone of efficient waveform representation in oscilloscopes, ensuring that the signals are depicted in a manner that's both understandable and actionable for engineers.
Here are three reasons why it's indispensable.
Accuracy in Visualization
Oscilloscopes take samples of signals at discrete intervals. However, in real-world applications, signals are continuous. Without interpolation, we'd only see disjointed dots or points on the oscilloscope's screen, making it nearly impossible to discern any meaningful information from the display.
Interpolation fills the gaps between these points, creating a continuous, coherent representation. This allows engineers to visualize and understand the behavior of the waveform not just at sampled points, but everywhere in between.
Bandwidth Limitations
Modern electronic applications often involve high-frequency signals. However, not all oscilloscopes have the capacity to sample these signals at a rate that captures all their intricate details. This sampling limitation is where interpolation proves its worth.
By estimating the values between sampled points, interpolation provides a more detailed view of the waveform, ensuring that high-frequency components don't go unnoticed. Without interpolation, crucial waveform features might be lost, leading to potential misinterpretations or oversight of key signal characteristics.
Improved Measurements
In engineering and electronics, precision is paramount. When analyzing a waveform, the more accurate our representation, the better our measurements. Interpolation refines the waveform display, enabling:
- Enhanced frequency analysis: By offering a more detailed waveform, interpolation ensures that frequency-related measurements, like harmonics, are more accurate.
- Reliable phase measurements: Phase differences can be critical, especially in applications like communication systems. A continuous waveform allows for exact phase determinations, minimizing errors.
- Accurate amplitude estimations: With interpolation smoothing out the waveform, amplitude peaks and troughs are displayed more accurately, ensuring that amplitude-related metrics, such as peak-to-peak voltage or RMS values, are reliably deduced.
In essence, interpolation doesn't just make waveforms look better – it fundamentally improves the quality of data analysis, leading to more informed decisions, better system designs, and enhanced troubleshooting capabilities.
Primary Interpolation Methods
There are various interpolation methods for reconstructing signals in oscilloscopes. Each method has its own strengths and weaknesses, making it crucial to carefully analyze and select the most suitable one. Let’s delve into the three primary methods.
1. Sin(x)/x (Sinc) Interpolation
The sinc interpolation method operates on the premise that the waveform is made up of band-limited signals. By employing the sinc function, it provides an ideal method for connecting data points for such waveforms. Among its main strengths is its superior accuracy for band-limited signals, along with a notable reduction in aliasing effects.
However, this approach isn't without its challenges. It demands high computational power, which might not be feasible for all oscilloscopes or real-time applications. For signals exhibiting sharp transitions, sinc interpolation might not be the most appropriate choice.
2. Linear Interpolation
Linear interpolation is straightforward in its approach. Each data point is connected directly to the next via a straight line, making it the most uncomplicated interpolation method. This simplicity lends itself to a fast execution, consuming minimal computational resources, and is particularly apt for visualizing fast transients in signals.
However, this speed and simplicity come at the cost of accuracy. Linear interpolation may not always offer the most accurate representation, especially for sinusoidal signals. In certain scenarios, it can overlook or under-represent finer details present in more complex waveforms.
3. Cubic Spline Interpolation
Shifting away from straight lines, cubic spline interpolation introduces polynomial functions between data points. This results in smoother and more continuous waveforms, giving it an edge over linear interpolation in terms of waveform fidelity. Signals that don't have a lot of high-frequency components benefit the most from this method.
It's important to note that this smoothness requires a higher computational load compared to linear interpolation. Cubic spline can sometimes introduce overshoot in waveforms, especially those with rapid transitions, which can lead to a misrepresentation of the original signal.
Comparing Interpolation Methods
| Method | Best Suited For | Computational Demand | Accuracy |
| Sin(x)/x (Sinc) | Band-limited signals | High | Very High |
| Linear | Signals with fast transients | Low | Moderate |
| Cubic Spline | Signals without high-frequency components | Moderate | High |
Which Method to Use?
Choosing the right interpolation method is a pivotal decision that can significantly influence the accuracy and clarity of your waveform representation.
- Understand your signal: Begin by analyzing the characteristics of your signal. For band-limited signals, sinc interpolation offers the highest fidelity, and ensures that you capture the nuances of your waveform.
On the other hand, when dealing with signals characterized by rapid changes or fast transients, linear interpolation often provides an optimal balance between speed and representation.
- Gauge your computational resources: It's crucial to match the interpolation method with the processing capabilities at hand. In real-time applications, where rapid data processing is vital, the computational demands of your interpolation method can't be ignored. Linear interpolation, with its modest resource demands, stands out in scenarios where processing speed trumps intricate accuracy.
- Prioritize smoothness when necessary: In applications where the visual smoothness of a waveform is paramount, cubic spline interpolation shines. By using polynomial functions to bridge the gaps between data points, it produces waveforms that are notably smoother and more continuous than those from linear interpolation.
Remember that it may introduce some inaccuracies, especially in waveforms with sharp transitions. Thus, always weigh the importance of visual smoothness against the potential for slight data distortions.
Challenges and Limitations
Every technological approach has its own set of constraints, and interpolation in oscilloscopes is no exception. While it significantly aids in waveform representation, understanding its limitations ensures effective and accurate usage. Here's a look at these challenges and limitations.
Alias Effects
The concept of aliasing is fundamental in signal processing. The Nyquist-Shannon sampling theorem establishes a critical sampling rate, known as the Nyquist rate, to accurately capture a signal. If an oscilloscope doesn't meet this rate, aliasing—where different signals become indistinguishable—will inevitably occur.
No interpolation method, regardless of its sophistication, can overcome the drawbacks of undersampling. If you're sampling below the Nyquist rate, the representation will be flawed, potentially leading to incorrect interpretations.
Overestimation and Overshoot
The pursuit of smooth and continuous waveforms can sometimes lead to unintended consequences. Methods like cubic spline interpolation, in their quest to create smooth transitions, might introduce overshoot.
This means that the interpolated waveform might momentarily exceed the actual signal's amplitude. Such inaccuracies, while seemingly minor, can be misleading, especially in applications where precise amplitude measurements are essential.
Not a Substitute for Sampling
Interpolation fills gaps, making discrete data points seem continuous. However, it's essential to understand that interpolation is, at best, an educated guess. It can't introduce new information; it can only work with what's already there.
If an oscilloscope misses crucial data during sampling, no interpolation method can accurately recreate it. The foundation of any reliable waveform representation is accurate sampling.
Potential for Misinterpretation
The visual smoothness provided by some interpolation methods can occasionally give a false sense of confidence. Users might assume that a smooth waveform equates to a more accurate representation, which isn't always the case. It's imperative to always interpret waveforms with an understanding of the chosen interpolation method's strengths and weaknesses.
Conclusion
Interpolation is more than just a theoretical concept in the world of oscilloscopes—it's the backbone of accurate and effective waveform visualization. As we've journeyed through this article, it's clear how essential it is to differentiate between the varied interpolation methods, be it the mathematically intricate sinc interpolation, the straightforward linear approach, or the smooth transitions provided by the cubic spline method.
Each technique, with its distinct advantages and potential downsides, is tailored to cater to specific scenarios and challenges faced in the realm of electrical engineering and beyond.
Equally important to the interpolation process is the equipment on which it's applied. If you understand the value of precision and wish to achieve unparalleled accuracy without compromising on budget, check out Keysight's Used Equipment Store.
Elevate your testing capabilities with quality oscilloscopes, network analyzers, signal analyzers, meters and more. Your signal's clarity and precision deserve nothing less.
Browse Oscilloscopes at a Great Discount
Whenever You’re Ready, Here Are 5 Ways We Can Help You
- Browse our Premium Used Oscilloscopes.
- Call tech support US: +1 800 829-4444
Press #, then 2. Hours: 7 am – 5 pm MT, Mon– Fri - Talk to our sales support team by clicking the icon (bottom right corner) on every offer page
- Create an account to get price alerts and access to exclusive waitlists.
- Talk to your account manager about your specific needs.