- Introduction
- What Are Spectrum Analyzers Used For?
- How Do Different Types of Spectrum Analyzers Work?
- Vector Spectrum Analyzer
- Swept Spectrum Analyzer
- FFT Spectrum Analyzer
- Real-Time Spectrum Analyzer
- How To Use a Spectrum Analyzer
- Spectrum Analyzer Buying Guide
- Buy a Premium Used Keysight Spectrum Analyzer and Save Up to 90%
- Closing Thoughts From Keysight
- Did You Know?
- Whenever You’re Ready, Here Are 4 Ways We Can Help You
A spectrum analyzer is a device used to measure the strength of an RF signal over a defined band of frequencies. The signal passes through a filter that allows only a specific range of frequencies, and the resulting signal is then passed through an amplifier and displayed on a screen.
The amplitude of the signal (the vertical axis on the screen) is then measured, and the plotted results represent the function of frequency (the horizontal axis). The overall shape of the resulting plot is the signal's spectral density.
Another primary function of a spectrum analyzer is to measure the power of known and unknown signals. Understanding how frequency, amplitude, and modulation parameters behave over short and long periods is critical to understanding the behavior of modern RF systems.
This article will look at the different types of spectrum analyzers, how they work, and their uses. This information will help you understand how to reliably detect and characterize RF signals that change over time.
What Are Spectrum Analyzers Used For?
By sweeping through the frequency spectrum, a spectrum analyzer provides a detailed analysis of the power of a signal at each frequency level. This information identifies which frequencies are responsible for the overall strength of the signal and troubleshoots any issue that causes a drop in signal strength. In addition, spectrum analyzers monitor a system's health by tracking changes in the strength of various signals over time.
A spectrum analyzer is a powerful tool used in
- Telecommunications to measure the performance of cellular networks and debug wireless communications.
- The defense industry to test radar systems and detect hostile emitters.
- Satellite communications to evaluate link quality and monitor interference.
- Broadcasting to ensure compliance with regulations and optimize transmitter performance.
- The aerospace industry to test aircraft avionics and ground-based radar systems.
- Medical research to study brain waves and investigate the effects of electromagnetic radiation.
For engineers learning about spectrum analyzers, another piece of test equipment often used in conjunction with them is an oscilloscope. Using a spectrum analyzer and an oscilloscope together provides a complete picture of a signal.
Spectrum analyzers measure the amplitude of a signal as a function of frequency. They characterize signals spread out over a wide range of frequencies, such as those generated by RF transmitters. On the other hand, oscilloscopes measure a signal's voltage as a time (time domain). They are often used to troubleshoot electrical circuits by observing the waveforms of the various signals passing through them over short and long intervals.
For example, if you are trying to optimize an RF transmitter, you may use an analyzer to measure the output power as a function of frequency. Then you can use an oscilloscope to measure the shape of the transmitter's output waveform. By looking at both the power spectral density and the waveform, you can better understand how the transmitter is performing and identify any areas that need improvement.
These analyzers are also excellent at detecting and measuring noise and spurious signals. Signal noise is any unwanted signal that is present in a system. Spurious signals are not supposed to be present in a system. Together, these two types of interference can diminish and distort a signal.
By analyzing the frequency spectrum of a signal, a spectrum analyzer produces a graph that shows the signal's amplitude versus frequency. The amplitude measurement is in decibels, and the frequency is in hertz. By comparing these two measurements, you can identify any out-of-band signals or noise that may be present. This allows you to isolate and remove noise and spurious signals, ensuring accurate measurements.
How Do Different Types of Spectrum Analyzers Work?
There are two types of analyzers – analog and digital. An analog spectrum analyzer uses various techniques, such as filters and tuned circuits, to measure the strength and frequency of a signal. Digital analyzers use Fast Fourier Transform (FFT) to analyze the signal. FFT is a mathematical algorithm that converts the signal from the time domain to the frequency domain. This function allows the digital spectrum analyzer to take measurements very quickly.
Let's look at some different subtypes of spectrum analyzers and their uses.
Vector Spectrum Analyzer
A vector spectrum analyzer measures the spectral characteristics of a signal. They measure the amplitude and phase of a signal at each frequency within its operating range.
These measurements then generate a plot of the signal's amplitude as a function of frequency. This plot can provide valuable information about the spectral characteristics of the signal, which can optimize its transmission over long distances. The spectrum is simply a representation of energy across different frequencies.
The heterodyne principle is a crucial concept in signal processing and communications. In its simplest form, it states that you can combine two signals close in frequency to produce a new signal at the difference of their frequencies. This new signal, known as the beat frequency, contains information about both original signals.
Vector spectrum analyzers make use of the heterodyne principle to analyze signals. By mixing the target signal with a known reference signal, the VSA can create a beat frequency that has characteristics of the original signal. The VSA can then analyze this beat frequency to determine the signal's amplitude, phase, and other properties. This aspect makes VSAs an essential tool for measuring and troubleshooting complex signals.
| VSA Pros | VSA Cons |
|---|---|
| Measure the magnitude and phase of a signal. This is important because many real-world signals are not sinusoidal and have different amplitudes at varying frequencies. | Limited frequency range. They can only measure signals at a specific frequency. |
| Characterize complex signals. A complex signal can be a combination of multiple sinusoidal signals with different amplitudes, phases, and frequencies. | Limited dynamic range. They can only accurately measure signals within a certain range of amplitudes. Combined with their restricted frequency range, this may be limiting for some applications. |
| The ability to generate eye diagrams. These are graphical representations of how well an electrical signal conforms to certain standards. Eye diagrams are commonly used in digital communications systems to assess signal quality. | Typically have a much higher learning curve than their traditional counterparts. New users may find it challenging to become proficient in their use. |
Swept Spectrum Analyzer
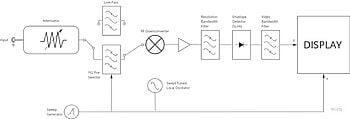
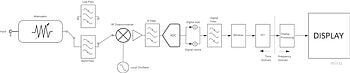
Swept spectrum analyzers sweep a sinusoidal signal across an RF (radio frequency) spectrum and measure the system's response under test at each frequency. It does this with the use of a local oscillator. The local oscillator's output signal mixes with the analyzer's input signal, and the resulting signal passes through a filter.
The amplified, filtered signal then travels to a detector which graphically shows the amplitude of the input signal as a function of frequency. The graph typically displays the results using a logarithmic scale for the amplitude (y-axis) versus a linear scale for the frequency (x-axis).
By observing the shape of the response curve, you can determine the system's center frequency, bandwidth, gain, and noise floor.
Swept spectrum analyzers troubleshoot and monitor RF systems, such as cellular communications, WiFi networks, satellite systems, and radar systems. They also measure the performance of RF components, such as filters, amplifiers, and antennas.
| Swept Spectrum Analyzer Pros | Swept Spectrum Analyzer Cons |
|---|---|
| Faster and easier to use. They take measurements in just a few seconds, while traditional spectrum analyzers can take several minutes. | Generally less sensitive than Fourier transform-based analyzers, making them less suitable for low-noise applications. |
| More accurate. Swept spectrum analyzers combine multiple measurements taken at different frequencies to create a more precise picture of the signal's power. Traditional spectrum analyzers measure the power of a signal at each frequency within its bandwidth. The strength of a signal can vary significantly from one frequency to another, resulting in an inaccurate measurement. | Subject to distortion due to how the signal spreads out over the frequency spectrum. |
| Less expensive. As they use fewer components than a traditional analyzer, a swept spectrum analyzer is an excellent choice if you need an affordable analyzer that is accurate and easy to use. | Requires a stable local oscillator. This can be challenging to generate for some frequencies. |
FFT Spectrum Analyzer
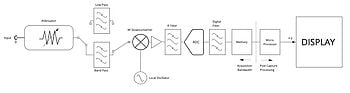
A Fast Fourier Transform (FFT) spectrum analyzer measures the strength of signals at different frequencies. A mathematical operation splits the signal into multiple frequency bins (a range of frequencies used to group similar signals for further processing), and the spectrum analyzer displays the amplitude of each bin. The analyzer's resolution comprises the number of points used to sample the signal and the number of bins used to represent the signal.
The FFT Spectrum Analyzer also examines the spectra of signals that are time-varying or non-periodic. It is also helpful for analyzing modulated signals by a carrier wave. The FFT Spectrum Analyzer also measures the power spectral density and identifies harmonics in a signal.
Various applications use FFT spectrum analyzers, including
- Telecommunications
- Acoustics and audio signals
- Radar
- Power quality monitoring
| FFT Spectrum Analyzer Pros | FFT Spectrum Analyzer Cons |
|---|---|
| Highly detailed measurements. FFT spectrum analyzers can provide more detailed information about the frequency components of a signal. This allows for a more accurate analysis of the signal. | Limited signal types. FFT spectrum analyzers only analyze periodic signals. This means they are not well suited for analyzing transient signals, such as those found in pulsed radar or communication systems. |
| Faster measurements. FFT spectrum analyzers are typically quicker than other spectrum analyzers, making them more efficient. | Spectral leakage. When performing FFT-based analysis, windowing artifacts can be a significant problem, especially when using short windows. If you apply a window to a signal, it creates discontinuities that break the periodicity. |
| Accuracy. FFT spectrum analyzers are less affected by noise than other types of spectrum analyzers. This makes them ideal in environments with a lot of signal noise. | Causes aliasing. Windowing can also cause aliasing, which occurs when high-frequency components read as low-frequency spectral components, leading to errors in the measurement. To overcome this, an anti-aliasing filter removes high-frequency components from the signal. |
Real-Time Spectrum Analyzer
Real-time Spectrum Analyzers (RSA) measure a signal's strength and frequency domain. As its name suggests, time-domain signals depend on time, whereas frequency-domain signals rely on frequency. RSAs use Fast Fourier Transform (FFT) to enable signal transformation from one domain to another, connecting the two. The time and frequency domains are effective analytical techniques that offer crucial information about signal properties.
RSAs provide a closer analysis of signal behavior by performing a "gapless" capture of the signal waveform, allowing you to see the signal's behavior over time in a single view. An RSA captures individual energy pulses with a time gate that opens and closes around each trigger event. The window size (gate) covers the expected pulse width plus a small margin to ensure the leading and trailing edges of the signal are both captured.
The trigger level detects signal energy above the noise floor, so blank sweep measurements (no signal triggers) are minimal. However, if the time between pulses is very short, gaps occur between capture sweeps.
Setting a low trigger level ensures that even weak signals will trigger a capture, while a short window width eliminates any delay in opening the gate when a pulse occurs. As a result, gapless capture provides a more accurate domain analysis of pulsed signals.
The RSA displays the domain information on a graph, which will help identify any problems with the signal. For example, too much noise or distortion will appear on the graph. Real-time analysis is mainly used in research and development settings as it is essential for characterizing signals and testing new equipment.
| Real-Time Spectrum Analyzer Pros | Real-Time Spectrum Analyzer Cons |
|---|---|
| Provides a more accurate picture of the signal environment. RSAs do not rely on taking samples of the signal at discrete points in time. Instead, they analyze the signal continuously, providing a “true” representation of the signal's behavior. | Often have reduced frequency resolution. This makes it difficult to identify subtle signal abnormalities. |
| Faster measurement setups and easier identification of signal anomalies. | Typically require more time to set up and configure than conventional models. |
| Easily configured to display only the information that is important to you. They offer great flexibility and insight into your signal environment. | Real-time analysis is less suited for analyzing very low-frequency signals. |
How To Use a Spectrum Analyzer
The controls and interface of a spectrum analyzer can vary depending on the model and manufacturer, but most spectrum analyzers have several standard features.
- You control the frequency span, range, and resolution by dials or buttons on the front panel. Adjusting these settings alters the range of frequencies displayed on the screen.
- The trace, or line, on the screen represents the strength of the signal frequency. You adjust the amplitude of the trace by using the vertical scale knob. Move the trace up and down on the screen by adjusting the offset.
- The level setting controls the maximum and minimum power levels displayed on the screen, known as the vertical scale. It is important to note that the level setting does not affect the actual power of the measured signal. You adjust the level setting by using the dial on the front panel.
- The time base, or sweep speed, is another important spectrum analyzer feature. This controls how long it takes for the trace to move across the screen. A faster sweep speed will allow you to see brief signal anomalies. Adjust the time base to suit your desired speed by using a dial on the analyzer's front panel. Most spectrum analyzers have an auto-scale feature that automatically adjusts the level and sweep speed settings. This is a convenient feature if you are unsure what settings to use.
Spectrum Analyzer Buying Guide
There are different aspects you will need to consider when shopping for a spectrum analyzer; from the resolution bandwidth to the phase noise performance and amplitude range. Let's look at some of the main factors to keep in mind when buying.
- Frequency range. The frequency range is an essential factor to consider because different spectrum analyzers measure different ranges of frequencies. For example, some spectrum analyzers measure audio frequencies (20 Hz – 20 kHz), while others measure radio frequencies (10 MHz – 10 GHz). Before buying a spectrum analyzer, it is important to figure out what frequency band you need to measure. Once you know this, you can narrow your search to a spectrum analyzer that suits your needs.
- Resolution bandwidth. The resolution bandwidth determines the minimum width of a signal that a spectrum analyzer can resolve, typically expressed in Hertz (Hz).
- A high-resolution bandwidth measurement allows for more detailed readings of narrow signals, while a low-resolution bandwidth measurement is better suited for reading broad signals. When choosing a resolution bandwidth, it is vital to consider the application for which you will use the spectrum analyzer.
- Span. The span refers to the range of frequencies an analyzer can measure. A wider span means the analyzer can measure a larger range of frequencies, which is helpful for troubleshooting or measuring signals with a wide frequency range. A good rule of thumb is to choose an analyzer with a span that is at least twice the bandwidth of the signal you want to measure.
- Amplitude range. The amplitude range is the difference between the largest and smallest signal a spectrum analyzer can measure. A larger amplitude range means an analyzer can measure a broader range of signal strengths. This is crucial as it allows for accurate measurements of very weak or powerful signals at different frequencies.
Buy a Premium Used Keysight Spectrum Analyzer and Save Up to 90%
If you are looking for a quality spectrum analyzer, look no further than Keysight. Our premium refurbished analyzers are the best on the market, available at a fraction of the price. We guarantee you will not have to compromise on performance and accuracy when buying from us.
If you are looking for a device that can measure a wide range of signals with precision and reliability, a Keysight premium refurbished spectrum analyzer is a perfect choice.
Closing Thoughts From Keysight
This article has looked at how spectrum analyzers work, what you use them for, and the different types of spectrum analyzers available today. This information will help you buy the perfect spectrum analyzer for your needs.
At Keysight, we are one of the leading manufacturers of spectrum analyzers. Our products are well known for their quality and reliability.
Right now, we are offering a special deal on refurbished premium spectrum analyzers. This is an excellent opportunity to get your hands on a top-of-the-line instrument at a very reasonable price. So don't wait – head on over to our used equipment page and buy a premium spectrum analyzer today!
Did You Know?
Keysight is the only company that can provide calibration. When you buy from our Used Equipment page, you can rest easy knowing that your spectrum analyzer has been thoroughly tested and calibrated, meaning you can get straight to work and have confidence that you are using a reliable piece of equipment.
No other reseller can provide that guarantee. That's why choosing Keysight for refurbished products is always the smartest choice.
While other resellers’ shipping times vary from 8-21 weeks, we guarantee that our equipment will reach your lab within two weeks*. Keysight Premium Used models are customizable, therefore the shipping process may be slightly longer. Browse our keysight spectrum analyzer offers and request a quote to speak to a sales agent today.
(* Two weeks shipping time offer available for US customers only. Dependent on item availability and location)
Whenever You’re Ready, Here Are 4 Ways We Can Help You
- Browse our premium used spectrum analyzer offers
- Call tech support US: 1 800 829-4444
Press #, then 2. Hours: 7am – 5pm MT, Mon– Fri - Talk to our sales support team by clicking the icon (bottom right corner) on every offer page
- Talk to your account manager for custom deals